![]()
DOI: https://doi.org/10.46502/issn.1856-7576/2025.19.03.9
Eduweb, 2025, julio-septiembre, v.19, n.3. ISSN: 1856-7576
Cómo citar:
Alenezi, A., & Alenezi, A. (2025). Data analytics in online course design and student engagement. Revista Eduweb, 19(3), 139-152. https://doi.org/10.46502/issn.1856-7576/2025.19.03.9
Análisis de datos en el diseño de cursos en línea y la participación estudiantil
Abdullah Alenezi
Professor, Northern border University, Arar, Saudi Arabia.
https://orcid.org/0000-0003-0233-6838
Abdulhameed Alenezi
Professor, Jouf University, Jouf, Saudi Arabia.
https://orcid.org/0000-0003-3801-5294
Recibido: 13/07/25
Aceptado: 01/09/25
Abstract
This study applies data analysis to the improvement of online course design and students’ learning outcomes in college course. Existing studies focus on the technical aspects of learning analytics and neglect comparisons between student and faculty perceptions, along with limited attention to their impact on the quality of online courses. This study aims to fill these gaps by exploring users' experiences with analytics tools in the Blackboard system at Northern Border University. It also seeks to understand how these experiences impact their perceptions of the quality of online course design. The descriptive analytical approach of a mixed method was applied in a survey of 160 students, 160 faculty members, 5 students, and 5 instructors. Both quantitative data gauged satisfaction, engagement, and usage of the Blackboard LMS analytics tools. In contrast, qualitative interviews with students and faculty asked about perceptions, experiences and recommendations for improving course design. Results show a strong link between interactive design elements and improved engagement and outcomes. Faculty and students highlighted several barriers, including limited training and underuse of analytical dashboards. The findings suggest actionable strategies for embedding data analytics in online learning design. Recommendations include faculty training, enhanced dashboards, and policy reforms to encourage data-informed pedagogy.
Keywords: Learning Analytics, Online Learning, Course Design, Student Engagement, Blackboard LMS, Higher Education.
Resumen
Este estudio aplica el análisis de datos a la mejora del diseño de cursos en línea y los resultados de aprendizaje de los estudiantes universitarios. Los estudios existentes se centran en los aspectos técnicos de las analíticas de aprendizaje y descuidan las comparaciones entre las percepciones de estudiantes y docentes, además de prestar poca atención a su impacto en la calidad de los cursos en línea. Este estudio busca subsanar estas deficiencias explorando las experiencias de los usuarios con las herramientas de analítica del sistema Blackboard en la Universidad de la Frontera Norte. También busca comprender cómo estas experiencias impactan sus percepciones sobre la calidad del diseño de cursos en línea. Se aplicó un enfoque analítico descriptivo de un método mixto en una encuesta a 160 estudiantes, 160 docentes, 5 estudiantes y 5 instructores. Los datos cuantitativos midieron la satisfacción, la participación y el uso de las herramientas de analítica de Blackboard LMS. Por el contrario, las entrevistas cualitativas con estudiantes y docentes indagaron sobre las percepciones, experiencias y recomendaciones para mejorar el diseño de los cursos. Los resultados muestran una fuerte relación entre los elementos de diseño interactivo y la mejora de la participación y los resultados. El profesorado y los estudiantes destacaron varias barreras, como la capacitación limitada y la infrautilización de los paneles analíticos. Los hallazgos sugieren estrategias prácticas para integrar la analítica de datos en el diseño del aprendizaje en línea. Las recomendaciones incluyen capacitación del personal docente, paneles de control mejorados y reformas de políticas para fomentar una pedagogía basada en datos.
Palabras clave: Análisis de aprendizaje, aprendizaje en línea, diseño de cursos, participación estudiantil, Blackboard LMS, educación superior.
Introduction
The digital transformation in higher education has led to a dramatic shift in the delivery of teaching and learning. Online learning environments have evolved from static, content-dumping platforms to complex ecosystems that track, analyse, and respond to student behaviour and performance in real-time (Alenezi 2021). In this time of transformation, learning analytics has become a powerful tool for enhancing online course design to enhance learning and student outcomes. The learning analytics term defines the collection, analysis, and reporting of data regarding learner (Prahani et al., 2022). Analytics tools allow teachers to gain frequent and retrospective insights into student activity and achievement, enabling teachers to create more responsive, personalised, and productive learning environments. However, despite widespread investment in learning management systems (LMSs) like Blackboard, the data analytics features have been underutilised. While the instructors may or may not have sufficient technical confidence to use analytics, few know what analytics can reveal (Ifenthaler & Yau, 2020; Schumacher & Ifenthaler, 2018). Unfortunately, students face serious issues when they experience online courses that are not set up for engagement or outcomes at the same time.
This study is intended to fill this gap by exploring how data analytics is used in online course design at Northern Border University. It uses quantitative survey data captured for students and faculty members collected via structured surveys along with qualitative insights gained from interviews. The research aims to provide actionable insights into how institutions can leverage data analytics to enhance course design, student satisfaction, engagement, and academic performance through answering the following questions:
Theoretical Framework or Literature Review
In the past five years, the applications of learning analytics in online education have grown in popularity, and there is an urgency to improve student outcomes using learning analytics and designing courses based on data. This literature review synthesized the current research (2020–2025) and the studies in Saudi Arabia and Gulf contexts to frame the integration of analytics into online environments in a local and global landscape.
Learning Analytics and Educational Enhancement
Nasseif (2023) defines learning analytics as collecting and analyzing data related to learners and their contexts to gain insights into and improve learning and its environments. Recently, there has been increasing interest in the application of learning analytics to monitor student engagement, predict academic success, and adapt instruction to student needs. Regarding online education, the potential of analytics to improve teaching effectiveness and student performance has grown more urgently in light of its shifting role for many institutions, especially following the onset of the COVID-19 pandemic. Recent research reveals that learning analytics can significantly impact improved student outcomes when integrated into the instructional design. This aligns with Sorour (2022) that students' grades and engagement in an engineering course improved if the analytics dashboards were incorporated into the course. Moreover, Nasseif (2023) discovered that analytics-supported interventions helped students learn how to self-regulate their learning and learn what they were learning.
The Saudi Arabian Context: Government Policy and Institutional Adoption
While Saudi Arabia may present an evolving education landscape, it is a country undergoing an extreme investment in digital transformation across all education levels under its Vision 2030. Research that is more recent also demonstrates how analytics can support ministry priorities to digitize learning environments and support national goals to improve quality and accountability in higher education. Sorour et al. (2022) are a notable study that analyzed the impact of learning analytics on King Saud University and that using analytics tools infused into the Blackboard LMS enabled faculty to spot struggling students in the earlier stages of the semester. Furthermore, their findings showed that it could accurately forecast final performance using more than 85 percent accuracy based on models based on student login frequency, assessment submission patterns, and forum participation. However, the study found that the lack of faculty training limited the lack of full-scale adoption. In line with this, Al Fraidan & Alelaiwi (2024) pointed out the necessity of digital faculty readiness to leverage learning analytics effectively. The study, which was conducted across several public universities in Saudi Arabia, showed that 75% of the faculty has access to LMS analytics. However, much less than that, or 30%, uses them to make teaching decisions. There were two reasons for the gap: technical challenges and insufficient professional development in educational data literacy.
Online Course Design and Data-Driven Pedagogy
The underlying issue is that how a course is designed online strongly impacts student satisfaction and academic success. More recently, related literature has emphasized the importance of further engaging learners through interactive and multimedia elements like quizzes, videos, and real-time feedback mechanisms. Learning analytics data can serve as a source of iterative quality in course design that reveals disengaging or less effective content. Al Fraidan & Alelaiwi (2024) examined the relationship between course design features and features that suggest analytics-informed student behavior. Specifically, they found that students doing courses with branching scenarios, embedded assessments, and real-time feedback tools had higher retention and satisfaction rates than those in traditionally structured online courses. In addition, the study showed that time spent on interactive content and participation in discussion boards were the most predictive data points of success. As Albazie (2023) states, these findings are fully supported globally in that learning analytics provides a feedback loop between course design and its learning outcomes. Their research across U.S. institutions found that data on student interaction was critical in tailoring course structure and pacing, especially in asynchronous environments.
Student Engagement and Analytics Use
Student engagement is a complicated construct with behavioral, cognitive, and emotional dimensions. It has been found that learning analytics can use patterned learning to measure and encourage engagement through participation patterns, submission timing, and LMS access. In a Saudi context, Mudawi et al. (2023) observe that undergraduate students' course time spent and active participation rate were increased with the use of Gamified elements deployed in online courses that were tracked using LMS analytics. Even though the literature convincingly proves the system's potential existence, several challenges are also mentioned. In a study entitled Sandy Al Fraidan & Adeel Alelaiwi (2024), which surveyed 540 students from 5 Saudi universities, the majority who believed that analytics tools could assist in learning (68%) did not use them actively (35%). Awareness, interface intuitiveness, and little training on how to interpret the data were barriers. This echoes broader international findings. As Mudawi et al. (2023) report, students rarely use available analytics tools unless they get trained or are pointed in the right direction in some sort of training module or while going through orientation. Thus, onboarding as a strategy to improve meaningful analytics usage is recommended, as is embedding data literacy into onboarding practices.
Institutional and Pedagogical Implications
These findings have implications in two directions. The first step is for institutions to focus on building a data-literate academic community by training faculty and students. The best practices in this area include workshops, mentoring programs, and analytics integration into professional development (Mukred et al., 2024). The second is that course design should be based on real-time data, informed by data, and revised with empirical evidence on what works and does not with course design. In addition, Mudawi et al. (2023) suggested a national perspective on the ethical use of learning analytics in Saudi universities. They underscored the need to incorporate data privacy and the responsible use of student information within institutional policies. Therefore, their framework is based on transparency, informed consent, and equitable democratization of analytics tools to guarantee trust and sustainability.
Methodology
Research Design
This study utilised a descriptive-analytical approach employing mixed methods to examine the use of analytics in course design. Integrating quantitative and qualitative data provided a comprehensive understanding of the research topic, offering a broad and deep exploration of analytics' application in educational contexts (Song et al., 2022). By combining surveys and semi-structured interviews, the study captured both general patterns of use and the nuanced experiences of individuals involved in the educational process (Muljana & Luo, 2021).
The quantitative aspect of the study involved the administration of structured surveys utilising Likert-scale questions. These questions were designed to quantify the extent to which students and faculty use analytic tools in their course design and decision-making (South et al., 2022). For measuring the degree of agreement or frequency of use on a scale, the Likert scale allows the respondents to indicate their level of agreement or frequency of use on a scale which permits measurement of the data and thus can be statistically analysed (Cacioppo, 2019). In this case, they preferred to have this type of data collection to have a wide variety of responses from many people to satisfy the generalizability of the findings (Yamashita, 2022). Therefore, by its very nature, it was structured so it resulted with a consistent and easy way to collect data with respect to some variables regarding analytics use.
For instance, the qualitative phase consisted of semi-structured interviews to gain more understanding of how participants worked with Blackboard analytics tools in course design. The open-ended questions used by this method also yielded rich and descriptive data to the researcher. Carey (2019) used the analytics guided questioning, mixed with a semi-structured format, to allow the participant to share personal view, challenge and eases. The qualitative data provided context to the quantitative results and helped to reveal underlying reasons and motivations for using analytics tools in the real world.
Participants
This study involved 320 participants who are 160 students and the other 160 are faculty members. Under a theoretical frame of stratified random sampling, a quantitative sample was created from various academic disciplines and levels of teaching experience in the sample (Nguyen et al., 2021). This sampling method was vital for the sample to contain representation of different opinions and practices in different types of fields of study. Stratified random sampling minimises selection bias because all key subgroups (e.g., academic departments or experience level) are proportionally sampled (Cacioppo, 2019). To conduct the qualitative phase, 10 people were purposively selected. Fifty of these participants, five students and five faculty members were selected to be included in this study as all were reported as using Blackboard analytics tools. Using this purposive sampling method, the researcher could specifically focus on people most knowledgeable or experienced with employing analytics and get richer and more targeted insights in response to the research question (Robinson, 2024). Additionally, Makwana et al. (2023), by making these participants engage directly with the tools, would be the practical and the specific ways in which the analytics influenced course design and delivery that would come to be reported in the qualitative data.
Data Collection Tools
Survey
The survey contained five sections pertaining to the participants' different experiences with online courses. Here is an explanation and expounding of each section.
The demographics section is used to gather background information about the participants that can be used to make sense of their responses. Questions on age, field of study, gender, academic standing, and if the candidate has had experience with online learning are usually covered in this section. It is to assist in-group participants in ways that may alter their responses or find sections in a specific group that forms a pattern. From an example, students with more previous experience of online learning may rate them differently in terms of satisfaction or engagement compared to learners new to online learning (Oettinger, 1971). For the most part, the demographics are required data to look at how age or level of experience might impact responses in the other sections.
This section gauges the participants' overall satisfaction with the structure and layout of the online course. It is about how well you are organized, clarity of instructional materials, is navigation easy on the learning platform, and the content of the course. Depending on the question, the survey could ask: How good was the course design as it related to the needs of the students, to the availability of materials, and whether the course felt like a module within the module, one module stretched to seamlessly flow into the next (Ifenthaler & Yau, 2020; Schumacher & Ifenthaler, 2018).These items give responses that allow instructors and course design to evaluate how effective the course design is and in what ways it could be improved.
It is the engagement section that defines the amount of attention students pay to course material. Often reading the assigned materials, watching videos, discussions, assignments, interactive activities. Usually, in the past, high student engagement has been understood based on a high rate of learning outcomes, and hence high student engagement is an important dimension of improving teaching strategies and content delivery (Brzezinski, 1970). The survey items that some assess whether students are motivated to engage in the course and to what degree students find the course content as engaging. It also checks if the students are only going through the course content or whether they are actually consuming it, and so can aid in developing the way courses are delivered so that they are maximally engaging for the students.
This part investigates the students’ strategies for following their progress and score in the Learning Management System. For instance, LMS tools feature such options as grade tracking, activity reports, and progress monitoring dashboards. This section measures the usefulness of these tools and whether students use them regularly to determine their level of understanding or improve their performance (García Aretio, 1999a). It also considers whether these analytics are perceived as valuable in guiding students forward or, in other words, adjusting their learning strategies. The responses can help institutions evaluate whether LMS tools are easy to use and whether they are helpful in supporting learning.
This section examines how the students see the relationship between their learning outcomes and the course design. The first one is to ask if the structure of the course, the way it was delivered, and the tools were responsible for their academic success in the end or for helping them reach their learning goals. Such ratings could be for their influence on a participant's understanding of the subject matter, developing critical skills, or a participant's academic performance more generally (García Aretio, 1999b). The results indicate whether the course promotes learning and suggest any improvements that can be made to align the course better to the intended outcomes. The survey has each section on a 5-point Likert scale ranging from 1 = strongly disagree to 5 = strongly agree to let the participants express how they feel about the statement being asked about. Using this scale helps researchers or educators easily quantify responses, analyse trends, and identify strengths and weaknesses of online learning experiences so that informed decisions can be made to improve them.
Interviews
The research was conducted through semi-structured interviews; one of the most commonly used data collection methods in qualitative studies. It was an approach that involved the development of interview protocols with open-ended questions to enable respondents to express what they think in their language. However, their views are consistent with the research questions. The interviews had a multi-faceted purpose of interest. The first was to get to know the participants' perceptions and understanding of how analytics can contribute towards enhancing learning in online learning, that is, their view as instructors and students. This is because perceptions are important and determine how tools and technologies are taken up in educational settings.
Additionally, the interviews aimed to describe participants' experiences using analytics to support teaching and learning. This could relate to how instructors may use data to personalise instruction, student progress, or identify points of focus. The study also sought feedback on how the analytics could be used to improve course design to determine if the data generated presented any insight into whether the data generated some actionable suggestions for altering course content and structure. This talk concludes with interviews, in which participants were asked to explain analytics dashboards, a visual representation of data that is sometimes overwhelming or confusing to interpret. The study could instead investigate how users are using these dashboards and uncover opportunities to improve design and user experience, as well as possible barriers to implementing other ideas in practice.
Validity and Reliability
The validity and reliability of the data collection tools used in the study, both the questionnaire and the interviews, were verified to ensure the reliability and accuracy of the results. For the questionnaire, the questions were reviewed by a group of education and educational technology experts to verify their suitability for the study topic. A pilot test was also conducted on a small sample of participants before the actual application to identify any ambiguity or difficulty in formulating the questions and adjusting them to align with the research objectives. Cronbach's Alpha was then calculated for the different sections of the questionnaire to ensure internal consistency. The results showed acceptable values that exceed the minimum accepted for scientific research (Drost, 2011).
The semi-structured interviews were further strengthened by peer review of the interview transcripts and data analysis, as well as by checking the repetition and continuity of participants' responses to ensure the accuracy of the information provided. Audio recording with written notes was also used to ensure accurate data transmission and avoid missing any important information. These procedures helped enhance the reliability of the results and improve the generalizability of the conclusions drawn from both qualitative and quantitative data.
Data Analysis
The data collection and analysis process was composed of both quantitative and qualitative techniques in such a way that helps to get an extensive interpretation of collected data. The study described and characterised the data using quantitative statistical methods for data analysis, such as descriptive statistics of frequencies, means and standard deviations for data collected from surveys or other instrumentation tools (Chalmers & Cowdell, 2021). This statistical approach gave a clear trend and distribution identification in the data to identify a general pattern. Correlation between variables was analysed using SPSS, a statistical software program, as the relationships between variables tend to be more complex. The analysis can show how one variable is correlated with the other. In this case, the correlation analysis can show to what extent the two variables are related or how perceptions of analytics and teaching effectiveness are related. A qualitative analysis was conducted on the terms of the transcripts using thematic analysis (Ayre & McCaffery, 2022). In this case, the key themes and patterns that were derived from the respondents' responses were identified and then coded. Through exposure to similar ideas or experiences, the researcher could have a deeper understanding of how participants looked at and incorporated learning analytics and their challenges (Lochmiller, 2021).
Ethical Approval
There must be ethical considerations regarding research in the field of human participants. This research was approved by the Institutional Review Board (IRB) of Northern Border University to ensure consistent ethics and guidelines for human research. In this process, the study also ensured that participants were kept anonymous and voluntary and that our prototype adhered to protocols that protected participants' rights and well-being, as Millum & Bromwich (2021) noted. All participants were informed of the purpose, who could study it, how it could be done, and any potential risks involved, and they gave their informed consent to participate (Stommel & Rijk, 2021). Maintaining integrity in ethical terms depends quite a lot on informed consent because it guarantees that participants are aware of the studies, that their will is free in the study, and their role and research goals.
Results and Discussion
Quantitative Findings
Student Satisfaction and Engagement
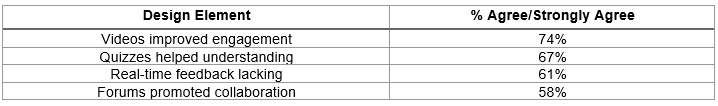
Student engagement matters greatly during the learning process and, to a large extent, retention and performance. A strong preference exists for interactive and multimedia content, as suggested by the fact that 74% of the students agreed that video lectures and embedded quizzes increased engagement. The video and the quizzes are more active elements, allowing the students to review the subject at their own pace and providing instant feedback to reinforce the learning. However, 61% of students felt that courses lacked real-time feedback, highlighting a potential area of improvement. Real-time feedback is crucial in helping students understand their progress and areas for improvement, which could enhance their overall learning experience. Additionally, 58% of students found discussion forums helpful for peer learning, showing the value of collaborative learning environments. Peer-to-peer interaction fosters a deeper understanding of the material, encourages critical thinking, and supports the development of communication skills. (see Table 1)
Table 1.
Student Perceptions of Online Course Design Elements
Use of Analytics Tools
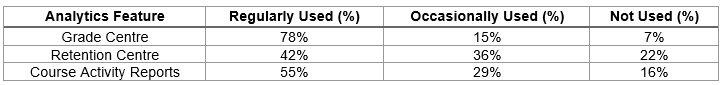
Analytics tools have the potential to significantly enhance teaching and learning, yet their utilisation is not widespread. Only 37% of students were aware of performance dashboards on Blackboard, suggesting that a substantial number of students are either unaware of or not utilising available resources to track their performance. This underutilisation may limit students' ability to monitor their progress effectively. On the faculty side, 42% regularly used analytics tools to adjust content, indicating that many instructors already leverage data to optimise course delivery. Moreover, the positive correlation between the use of analytics and student performance (r = 0.52, p < 0.01) underscores the effectiveness of data-driven teaching strategies in enhancing learning outcomes. (see Table 2)
Table 2.
Faculty Use of Blackboard Analytics Features
Impact of Design Elements
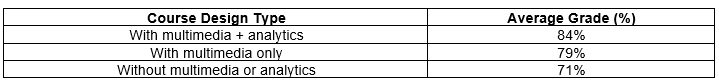
The design elements of a course can have a profound impact on student performance. The finding that students in courses using multimedia elements (e.g., videos, quizzes, interactive modules) performed better by 8% suggests that incorporating such elements fosters a more engaging and effective learning environment. Multimedia content caters to different learning styles, which can improve understanding and retention. Furthermore, there is a statistically significant difference in engagement between students in courses with embedded analytics and those without (p < 0.05). Besides helping instructors modify content to meet students' needs, analytics availability enables students to gain insight into their performance in real-time and boost engagement and motivation. Together, these designs are responsible for better learning outcomes and greater satisfaction. (see Table3)
Table 3.
Student Academic Performance Comparison
Qualitative Findings
Theme 1: Awareness and Perceived Value
This theme underscores a massive gap in awareness among students and faculty around using data analytics in the learning management system (LMS). Most of the students interviewed did not realise that performance dashboards and progress tracking tools were available through Blackboard. Instead, they considered the LMS a portal for accessing course materials, submitting assignments and participating in discussions, without seeing the analytical insights it could practically provide (Bradley, 2021). Because they lack awareness of their effectiveness at learning, they are impeded from taking ownership of their learning progress or self-regulating at a practical level using data.
At the same time, faculty recognised that analytics could help track activity and engagement and as a trend in students' performance. Even though they already knew the value of the tools, they admitted they were not using them properly. The main reason for this underutilisation comes from the fact that very few people had formal training in the use of LMS or had full capacity knowledge of the LMS' capability. Many educators learned about analytics tools informally or by trial and error and did not apply them consistently or strategically. Thus, some important data never got into the mix or could not be fully interpreted.
This theme points to a gaping chasm: while the potential of learning analytics is generally perceived as a useful tool, the actual knowledge and use of these tools are still very low, particularly from the students' side. This gap could be bridged by raising awareness and providing analytics literacy in student orientation and faculty development programmes. It takes both groups without first recognising the existence and benefit of the tools to fully utilise the LMS in order to achieve learning outcomes or instructional effectiveness.
Theme 2: Barriers to Effective Use
Blackboard indeed provides analytics features, yet faculty and students alike have daunting hurdles to overcome in their attempts to use them. The first was that instructors find it difficult to interpret data visualisations. Some found the dashboards too techno or had incorrect labels, making it difficult to glean valuable insights. For example, if heatmaps or engagement scores were offered, it was not clear how to act on these visuals to inform key decision points in instruction. Several faculty participants mentioned that the absence of contextual guidance caused them to avoid using the analytics tools.
Students made it clear that their frustrations rang out from their side. The people who interacted with the performance metrics became confused about what the data meant or what action to take. For instance, they could see their grades or the completion rate, but they could not understand how these indicators represented their learning progress or how to enhance their learning. Students wanted a more intuitive design with apparent connections between data and actionable feedback. For example, The LMS should show that the assignment was late or that one missed a quiz but also show this inability to larger learning objectives or course standing. The other major obstruction was the lack of an official learning curve or support system. Each group also observed that they would be utilising analytics tools without any or very little training. Growing institutional support was especially stressed by instructors for developing analytics literacy. Even if these obstacles are removed, the real potential of learning analytics to improve teaching and learning is largely unmined.
Theme 3: Recommendations for Improvement
Several constructive recommendations are offered by participants for improving how data analytics are shown and used in the LMS. Real-time alerts for students and faculty were among the most commonly suggested features. They wanted instant notifications for missed deadlines, bad scores and inactivity in discussion forums rather than end-of-the-week summaries. These real-time nudges can lead to taking timely action and helping them avoid falling behind. Faculty members wanted the possibility of alerts that would indicate students at risk based on engagement patterns or because of assessment so that they could step in earlier.
Another was progress indicators. The students wanted visual representations of how they had performed timelines or progress bars that could help indicate some pacing and fit of progress. They did not want to parse grade spreadsheets or static reports; they wanted to see how far they had come on a simple, colour-coded report with what is left to go.
Both students and faculty suggested crucial formal training on analytics tools. Faculty also felt that analytics integration needed some institutional support (e.g., workshops, how-to guides, peer mentoring). To empower students to track and act on their data independently, students proposed embedding data literacy in orientation sessions or online learning modules.
Participants also suggested improving the user interface of the analytics dashboards. Instead, they suggested more 'intuitive and user-friendly' designs that would illuminate 'actionable information' over raw data. Together, these suggestions offer a view of the sort of analytics tools that will inevitably be functional but will also support learning and teaching in day-to-day, practical ways.
Theme 4: Role of Analytics in Pedagogy
The final theme touches on the emerging importance of analytics to the pedagogy. An analysis of how analytics tools were used indicated that faculty members better understood student behaviours and learning needs (Alzahrani & Alzahrani, 2025). These students were described as disengaged, falling behind, or facing difficulties with specific content areas, and their engagement was identified based on performance data. By gaining this awareness, they could intervene through emails, one-on-one call-ins or adaptive feedback strategies that may not have happened without the insight from the analytics.
Additionally, several instructors described how analytics directly impacted the assessment design and instructional pacing. Some schools revised content delivery or added supplemental materials inspired by low completion rates or quiz failures in a given module. Others reported using engagement metrics to determine when to start collaborative activities or break long instructional videos into smaller bits. Feedback loop—Analytics provides feedback to learners and between teachers, adjusting that pedagogy in real-time.
Meanwhile, some of the faculty began to see analytics as a means to move from a one-size-fits-all teaching approach to a more differentiated approach. By observing usage patterns and performance trajectories, they could more effectively respond to the student needs served. However, this was most effective for faculty who were already data literate or who wanted to be. When used in meaningful ways, analytics supports pedagogical reflection and improvement, leading to improved learning outcomes and better learning outcomes. Embedding analytics into curriculum planning and instructional strategy promotes student success and ongoing teacher improvement.
Discussion
This study confirms that data analytics have great promise for improving course design and enhancing learning outcomes but have not been very widely employed in educational settings. Given this potential for transformation, it appears that there are some barriers to the wider use and effective deployment of analytics tools. If you are going to use analytics to improve teaching and learning, these barriers have to be removed.
The key findings in this study correspond well with those of Ifenthaler & Yau, 2020; Schumacher & Ifenthaler (2018), namely that there is a frequent 'technical' and training-related limitation for faculty to get involved with analytics. However, as faculty members in the present study admitted, many faced challenges translating analytics into their courses because of the technical complexity of the tools as well as the inability to see what specific use of the tools was appropriate or meaningful in their teaching. This is an indication of a large lack of the supportive structures that faculty members need. Though faculty wanted to use analytics to help design courses, many lacked technical skills or lack of support at the institutional level that would fully embrace and leverage the potential of these tools. This result reinforces the necessity of an institution to provide full training programs and easily usable interfaces to make analytics usage easier and more available to instructors.
The study also demonstrated that if courses utilise multimedia aided with various tools, students are highly satisfied and have better academic performance. In addition, reinforces the need of the thoughtful course design in online learning environments effectiveness. Adding multimedia elements to a learning area such as videos, interactive simulators, data visualisations which are related to analytics make the student engagement and understanding much higher. Therefore, together with dynamic learning materials, analytics tools make it possible for instructors to obtain valuable data about student behaviour allowing them to continuously adapt and refine course content (Kumar et al., 2021; Kyne et al., 2023). By integrating data driven feedback into the course design, it enables more personalized and responsive learning experiences that lead to the improved student success.
It also investigated the relationship between the use of analytics for course change and student success and found that change with data could enhance learning. As stated by Alzahrani & Alzahrani (2025), faculty were able to use analytics that tracked student engagement and progress in deciding what forms of course materials and support mechanisms students needed more of. One such as an example is that instructors who were able to identify which students were struggling early could have taken proactive intervention on the part of giving additional resources or guidance to help them get back on track before, they fell too far behind. Thus, this capacity to act on insights from analytics is manifested in a more personalised learning environment, where students are propped up at the moment when the need arises.
Additionally, the study obtained qualitative data from the students as well as the faculty and with that it was clear what the users were able to do while working with analytical data. While both groups were interested in using analytics to inform their decision-making better, many participants believed that the tools were still not readily accessible, actionable or included in their pedagogical practices. Faculty members were keen to learn from the data to improve their teaching, but those with the data lacked the expertise to understand it. Students found interest in getting feedback based on analytics, but many said they did not have enough knowledge of data to use it to learn better. This implies that for analytics to be effective, they need to be interpretable and available. Faculty and students need assistance understanding how to read and apply analysis from analytics tools to make meaningful course design or learning strategy changes based on the analysis.
This agrees with Alenezi (2021) that for analytics to positively impact education, they must have an actionable role within pedagogical practices. Additionally, data analytics should not be viewed as discrete tools but as parts of a larger whole of teaching and learning (Martín, 2011). Institutional support will be needed to help educators and students understand how to use analytics within the domain of the course and the learning goals for implementing this integration. Second, the analysis must deliver clear guidelines to guide both faculty and students in harnessing the insights made available by analytics for the greatest good.
Under the broader scope of educational technology, this study adds a holistic view of how analytics support the course design process. It does so by offering insights into the use of the system and the pedagogical implications of using analytics tools in the classroom. The findings indicate that while the enormous potential for data-driven course enhancement lies, technical and other obstacles must be climbed first, such as a lack of training, actionable insights, or simply a 'technical leak' from 'day 1' to 'day 13.' According to these findings, the study recommends how institutions should improve faculty training, make sure that the analytics tools are easy to use, and tell them where to interpret and take action with the data. If taken, this approach would raise the effectiveness of analytics in the course design and create a data-literate educational community where both faculty and students could derive the best insights from the analytics. The use of data analytics in course design promises excellent results (Fahd & Miah, 2023). However, technical, pedagogical, and training challenges limit the impact of data analytics in course design in the current state (Albazie, 2023). Such barriers can be overcome as institutions provide easier access and more actionable analytics tools for analytics tools, unlocking the true potential of data-driven teaching and practice, resulting in improved student outcomes and better course designs.
Conclusions
When implemented effectively, learning analytics hold significant transformative potential for enhancing online course design and improving student outcomes. These tools give educators and learners real-time insights on engagement, progress and performance to ensure a more responsive and targeted educational experience. Nevertheless, the effective use of learning analytics for classroom practice is primarily stifled by institutional constraints, particularly a lack of sufficient training and the convoluted requirements of the interface. The data are often underutilised because faculty and students fail to interpret and utilise the data without sufficient support structures. Several strategic actions are needed to address these challenges. Institutions should first put regular workshops to 'read' and 'apply' analytics to pedagogy for faculty development. These sessions should serve as a way for the data to influence teaching beyond technical instructions and into how to teach data. Simultaneously, in parallel to these LMS platforms, namely Blackboard, dashboard redesigns must be made to focus on simplicity and clarity. However, current visualisations are too complex or unintuitive and thus will often encourage their not use. User-friendly interfaces can be significantly streamlined to enhance usability and make instructors more likely to adopt them.
In addition, there must be student engagement with analytics from the start. Data literacy navigating dashboard elements can be integrated into orientation programs to enable learners to assume responsibility for their progress and make responsible decisions about their study habits. In other words, policies that formally and positively institutionalise the encouragement and reward of data-driven course evaluation and curriculum development are also needed. Some policies that encourage innovation, accountability, and continuous assessment are necessary to integrate analytics into the educational culture. The last step is continuously taking course design as an iterative process based on analytics data and students' feedback. By applying this cyclical approach, there is time to adjust as required to align content with learner needs and institutional goals. Future research should provide a longitudinal account of how analytics-informed design impacts institutions, disciplines, and populations across various learners. Therefore, comparative studies could reveal knowledge about which best practices work in which contexts and uncover context-specific challenges and implementable, scalable implementation models that can be adapted for varied educational environments.
Bibliographic References
Albazie, H.A. (2023). Factors affecting the use of e-learning in Saudi Arabia: An analysis of academics’ perspectives (Unpublished thesis PhD), University of Glasgow.
Alenezi, M. (2021). Deep dive into digital transformation in higher education institutions. Education Sciences, 11(12), 770. https://doi.org/10.3390/educsci11120770
Al Fraidan, A., & Alelaiwi, M. (2024). Digital transformation for sustainable English language learning: Insights from Saudi Arabia and global perspectives. Forum Linguistic Studies, 6(6), 439–449. https://doi.org/10.30564/fls.v6i6.7754
Alzahrani, A., & Alzahrani, A. (2025). Understanding ChatGPT adoption in universities: The impact of faculty TPACK and UTAUT2. RIED-Revista Iberoamericana de Educación a Distancia, 28(1), 37–58. https://doi.org/10.5944/ried.28.1.41498
Ayre, J., & McCaffery, K.J. (2022). Research Note: Thematic analysis in qualitative research. Journal of Physiotherapy, 68(1). Available at: https://acortar.link/qAKYsa
Bradley, V.M. (2021). Learning Management System (LMS) use with online instruction. International Journal of Technology in Education, 4(1), 68–92. Available at: https://eric.ed.gov/?id=EJ1286531
Brzezinski, Z. (1970). La era tecnotrónica. Barcelona: Paidós.
Cacioppo, S. (2019). Evolutionary theory of social connections: Past, present, and future. Ninety-ninth Annual Convention of the Western Psychological Association, Pasadena, CA, United States. Available at: https://westernpsych.org/wp-content/uploads/2019/04/WPA-Program-2019-Final-2.pdf
Carey, B. (2019). Can we get better at forgetting? The New York Times. Available at: https://www.nytimes.com/2019/03/22/health/memory-forgetting-psychology.html
Chalmers, J., & Cowdell, F. (2021). What are quantitative and qualitative research methods? A brief introduction. Dermatological Nursing, 20(2), 45.
Drost, E.A. (2011). Validity and Reliability in Social Science Research. Education Research and Perspectives, 38, 105-123. https://acortar.link/NZc965
Fahd, K., & Miah, S.J. (2023). Designing and evaluating a big data analytics approach for predicting students’ success factors. Journal of Big Data, 10(1), 159. https://doi.org/10.1186/s40537-023-00835-z
García Aretio, L. (1999a). Fundamento y componentes de la educación a distancia. RIED. Revista Iberoamericana de Educación a Distancia, 2(2), 28–39. https://hdl.handle.net/20.500.14468/11298
García Aretio, L. (1999b). Historia de la educación a distancia. RIED. Revista Iberoamericana de Educación a Distancia, 2(1), 11–40. https://doi.org/10.5944/ried.2.1.2084.
Ifenthaler, D., & Yau, J. Y. K. (2020). Utilising learning analytics to support study success in higher education: A systematic review. Educational Technology Research and Development, 68(4), 1961–1990. https://doi.org/10.1007/s11423-020-09788-z
Kumar, K.A., Worku, B., Sisay Muleta Hababa, B.R., & Prasad, A.Y. (2021). Outcome-based education: A case study on course outcomes, program outcomes, and attainment for big data analytics course. Journal of Engineering Education Transformations, 35(2), 2349–2473. ttps://doi.org/10.16920/jeet/2021/v35i2/153364
Kyne, S. H., Lee, M. M. H., & Reyes, C. T. (2023). Enhancing academic performance and student success through learning analytics-based personalised feedback emails in first-year chemistry. Chemistry Education Research and Practice, 24, 971–983. https://doi.org/10.1039/D3RP00032J
Lochmiller, C.R. (2021). Conducting Thematic Analysis with Qualitative Data. The Qualitative Report, 26(6), 2029–2044. https://doi.org/10.46743/2160-3715/2021.5008
Makwana, D., Engineer, P., Dabhi, A., & Chudasama, H. (2023). Sampling methods in research: A review. International Journal of Trend in Scientific Research and Development, 7(3), 762–768. http://www.ijtsrd.com/papers/ijtsrd57470.pdf
Martín, S. (2011). Educación aumentada: Realidad o ficción. Blog CUED. https://goo.gl/w46mpA
Millum, J., & Bromwich, D. (2021). Informed consent: What must be disclosed and what must be understood? The American Journal of Bioethics, 21(5), 46–58. https://doi.org/10.1080/15265161.2020.1863511
Mudawi, N. A., Pervaiz, M., Alabduallah, B. I., Alazeb, A., Alshahrani, A., Alotaibi, S. S., & Jalal, A. (2023). Predictive Analytics for Sustainable E-Learning: Tracking Student Behaviors. Sustainability, 15(20), 14780. https://doi.org/10.3390/su152014780.
Mukred, M., Mokhtar, U. A., Hawash, B., AlSalman, H., & Zohaib, M. (2024). The adoption and use of learning analytics tools to improve decision making in higher learning institutions: An extension of technology acceptance model. Heliyon, 10(4). https://doi.org/10.1016/j.heliyon.2024.e26315
Muljana, P.S. and Luo, T. (2021). Utilizing learning analytics in course design: Voices from instructional designers in higher education. Journal of Computing in Higher Education, 33(1), 206–234.
Nasseif, H. (2023). Historic Learning Analytics Transforming Learning in Saudi Arabian Higher Education. In: Active and Transformative Learning in STEAM Disciplines. Emerald Publishing Limited, pp. 79–102.
Nguyen, T.D., Shih, M.H., Srivastava, D., Tirthapura, S. and Xu, B., (2021). Stratified random sampling from streaming and stored data. Distributed and Parallel Databases, 39, 665–710. https://doi.org/10.1007/s10619-020-07315-w
Oettinger, A.G. (1971). Communications in the national decision-making process. In: Greenberger, M. (ed.) Computers, communication, and the public interest. Baltimore, MD: Johns Hopkins Press, pp. 73–114.
Prahani, B., Alfin, J., Fuad, A., Saphira, H., Hariyono, E., & Suprapto, N. (2022). Learning management system (LMS) research during 1991–2021: How technology affects education. International Journal of Emerging Technologies in Learning (iJET), 17(17), 28–49. https://www.learntechlib.org/p/223118/
Robinson, R.S. (2024). Purposive sampling. In: Encyclopedia of quality of life and well-being research. Cham: Springer International Publishing, pp. 5645–5647. https://doi.org/10.1007/978-3-031-17299-1_2337
Song, D., Shin, Y., & Hong, H. (2022). Learning analytics as an integrated approach in mixed methods research. In: The Routledge Handbook for Advancing Integration in Mixed Methods Research, pp. 288–300. Routledge. eBook ISBN9780429432828
Sorour, A. (2022). Holistic Framework for Monitoring Quality in Higher Education Institutions in the Kingdom of Saudi Arabia using Business Intelligence Dashboards. (PhD Unpublished thesis), Staffordshire University.
Sorour, A., Atkins, A.S., Stanier, C., Alharbi, F., & Campion, R. (2022). The development of business intelligence dashboard for monitoring quality in higher education institutions in Saudi Arabia including sentiment analysis from social media. In: Inted2022 Proceedings, pp. 1391–1399. IATED.
South, L., Saffo, D., Vitek, O., Dunne, C., & Borkin, M.A., (2022). Effective use of Likert scales in visualization evaluations: A systematic review. Computer Graphics Forum, 41(3), 43–55. https://doi.org/10.1111/cgf.14521
Stommel, W., & Rijk, L.D. (2021). Ethical approval: None sought. How discourse analysts report ethical issues around publicly available online data. Research Ethics, 17(3), 275–297. https://doi.org/10.1177/1747016120988767.
Schumacher, C., & Ifenthaler, D. (2018). Features students really expect from learning analytics. Computers in Human Behavior, 78, 397–407. https://doi.org/10.1016/j.chb.2017.06.030
Yamashita, T. (2022). Analyzing Likert scale surveys with Rasch models. Research Methods in Applied Linguistics, 1(3), 100022. https://doi.org/10.1016/j.rmal.2022.100022

Este artículo no presenta ningún conflicto de intereses. Este artículo está bajo la licencia Creative Commons Atribución 4.0 Internacional (CC BY 4.0). Se permite la reproducción, distribución y comunicación pública de la obra, así como la creación de obras derivadas, siempre que se cite la fuente original.